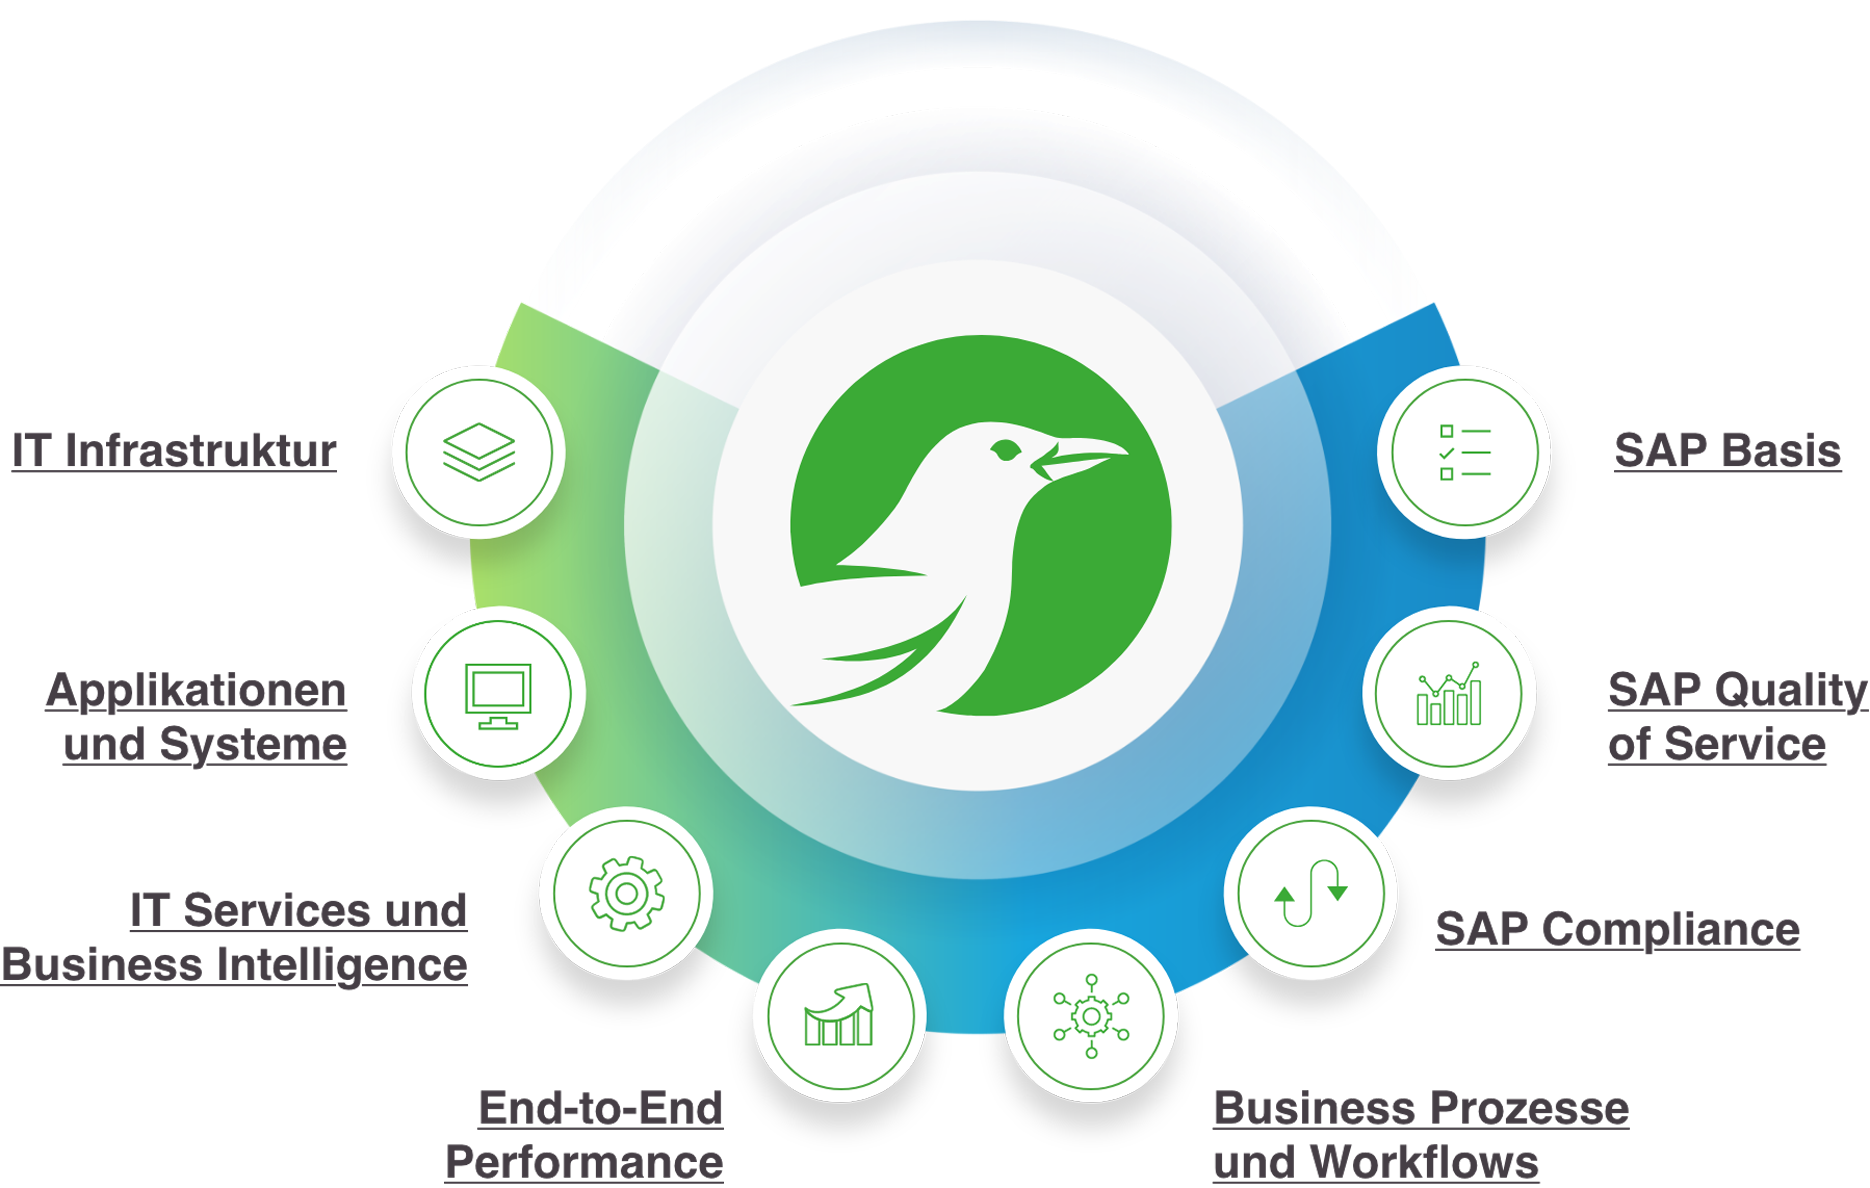
Your Benefits!

All registered users have access to exclusive content and videos. With your own Wotan Account you can also test our brand new Wotan Dashboards with its different configurations LIVE and for FREE.

Not registered yet?

Newsletters

WOTAN Version 10 Release

NEW: Light & Dark Mode

The WOTAN GUI has been reworked. WOTAN is now available in a light and dark mode. You can choose your preferred mode in your dashboard settings. The selected mode is used in your dashboards, the configuration and even in most of the addons.  As Grafana is used as the new default visualization tool the monitoring charts can be displayed in these 2 modes as well.

Extension: Business Intelligence Monitoring with Expressions

The new expression editor for Business Intelligence Monitoring allows to define complex relations and dependencies of your IT and your applications.

The BI Expression engine supports executing JavaScript Code. In addition to simple expression following features are available:

  • Loops (for, while)
  • Conditions (If/Else)
  • Variables and Functions
  • Native JavaScript Functions for Strings, Arrays, Regular Expressions, Date Objects.

A detailed documentation of the new Expression Editor/Engine is available in your WOTAN Wiki.


NEW: Monitoring & Alerting API

WOTAN Monitoring API

  • Central API including Support for satellite systems
  • Host & Service State Requests
  • Host & Service Actions
    • Acknowledgement
    • Scheduling & Deleting Downtimes
    • Executing checks on demand
    • Enabling/Disabling checks
    • Enabling/Disabling notifications
    • Trigger notification process

A detailed documentation is available on every WOTAN 10 system:
    https://<<wotan.local>>/wotan/services/api/v1/wotan-monitor/index.html


WOTAN Alerting API

  • Creating new alerts
  • Acknowledging alerts
  • Deleting alerts
  • Searching for alerts
  • Fetching alert details

A detailed documentation is available on every WOTAN 10 system:
    https://wotan.local/wotan/services/api/v1/wotan-alerting

NEW: Staging

Staging is an additional step to more monitoring quality. Changes of Hosts and Services are not activated automatically but has to be approved before going live. Until then, Hosts and Services can be tested, watched and modified in a separate monitoring system.

Requirements:

  • 2 WOTAN Manager Systeme:

    • Quality Q

    • Production P

    • Optional: Satellites

Features:

  • Configuration is only done on the Q system

  • Changed and not approved Hosts/Services are monitored on the Q system. On P only the approved configuration remains active.

  • Pull/Push operations to transfer approved Hosts/Services from Q to P.

  • Reject feature for reverting changes on the Q system by replacing Host/Service configuration with the current configuration of P

  • MQTT Support for special security requirements

Extension: Dashboards

The following new features are now available for WOTAN Dashboards and Widgets:

  • Support of multiple site in the Downtimes Widget
  • Support of multiple site in the Performance Matrix Widget
  • Dashboard Rotation for switching dashboards automatically

NEW: Grafana

Grafana is the new default visualization tool for rendering monitoring performance counters. Grafana provides a modern design, multiple visualization options and supports the light & dark modes of WOTAN 10. Besides replacing the known PNP4Nagios charts out of the box custom charts and dashboards of various data-sources can be created with just a few clicks. Grafana in WOTAN 10 supports visualizing data from other satellites out of the box.

INFO: Checks & other Changes

Detailed information about all changes and new checks can be found on the WOTAN Download portal. Changelog